Why aren't patients ordering the life-saving medication they need? I used data to answer this question and designed a better refill experience that increased adherence by 6% and decreases operational costs by 1.4 million dollars each year.
CONTEXT
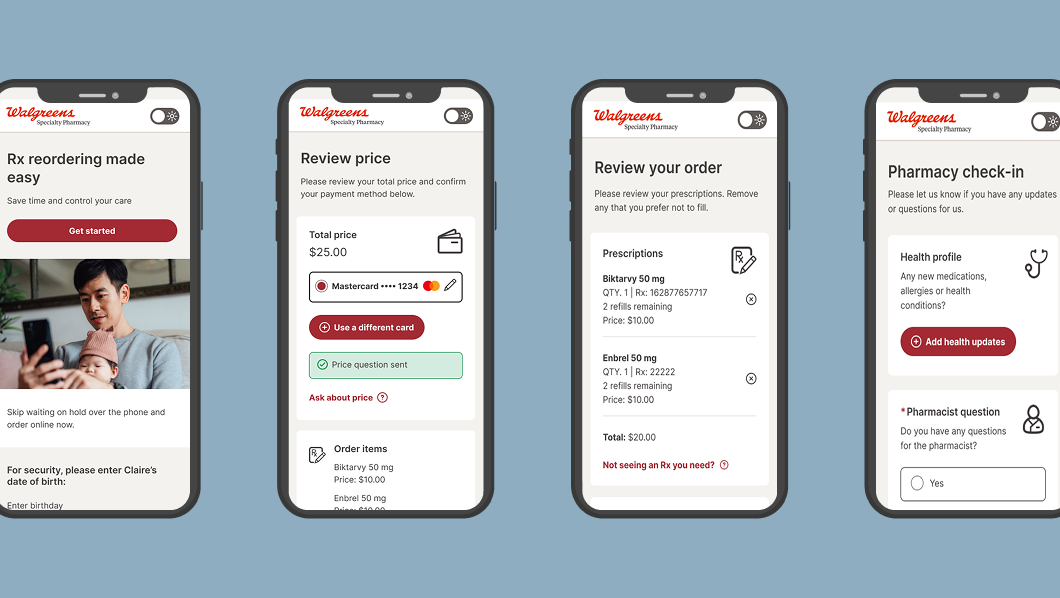
Patients aren't filling their prescriptions on time. They delay them until the prescription expires and when they finally want the medication, they have to call in and a Walgreens customer service rep must manually reopen the prescription. This places a huge strain on Walgreens operationally as employees have to call patients who miss a fill and manually track them down to understand why they aren't filling an order.
GOAL
Increase prescription refill rates and understand patient behavior, improve patient journey
SCOPE
Timeline: 3 months
My role: UX lead & data-analysis
Team: 1 UX designer (me), 1 product manager, operations team lead, engineering lead
My role: UX lead & data-analysis
Team: 1 UX designer (me), 1 product manager, operations team lead, engineering lead
DATA ANALYSIS
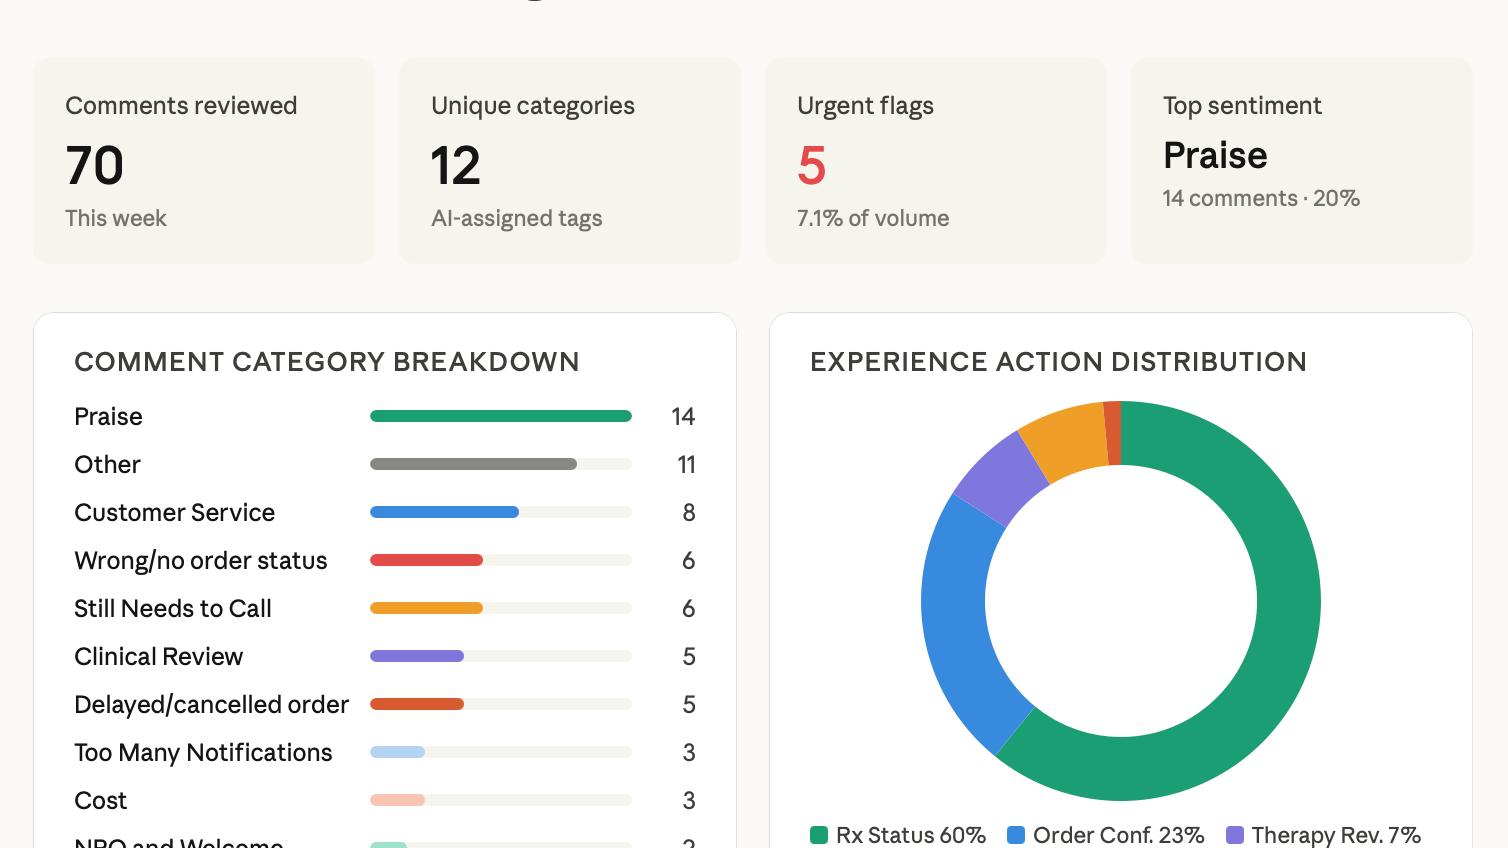
I used Tableau to analyze patient behavior and discovered that patient need and pharmacy expectations are misaligned. Many patients end up taking longer to finish their medication than Walgreens anticipates, because of unexpected health progressions or lack of adherence. I presented these insights to the operations and UX leads and broke down data into digestible tidbits.
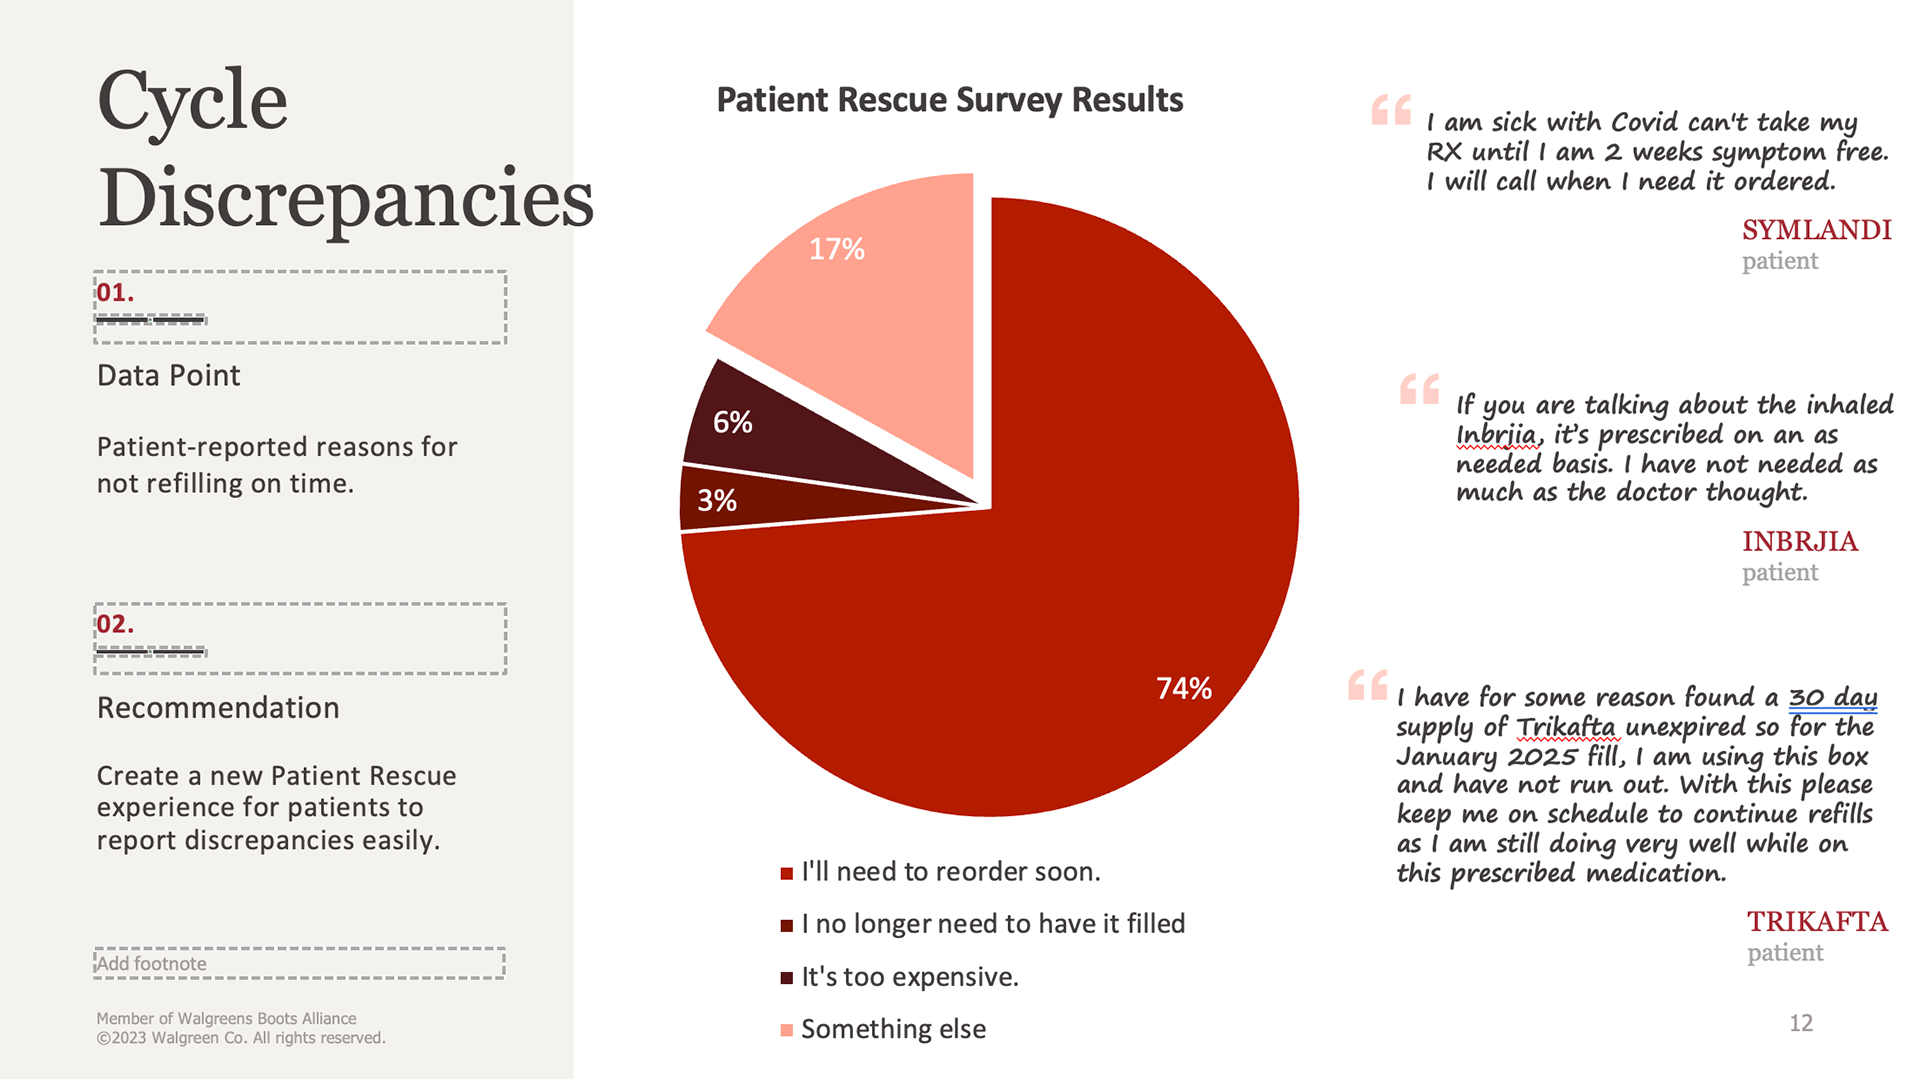
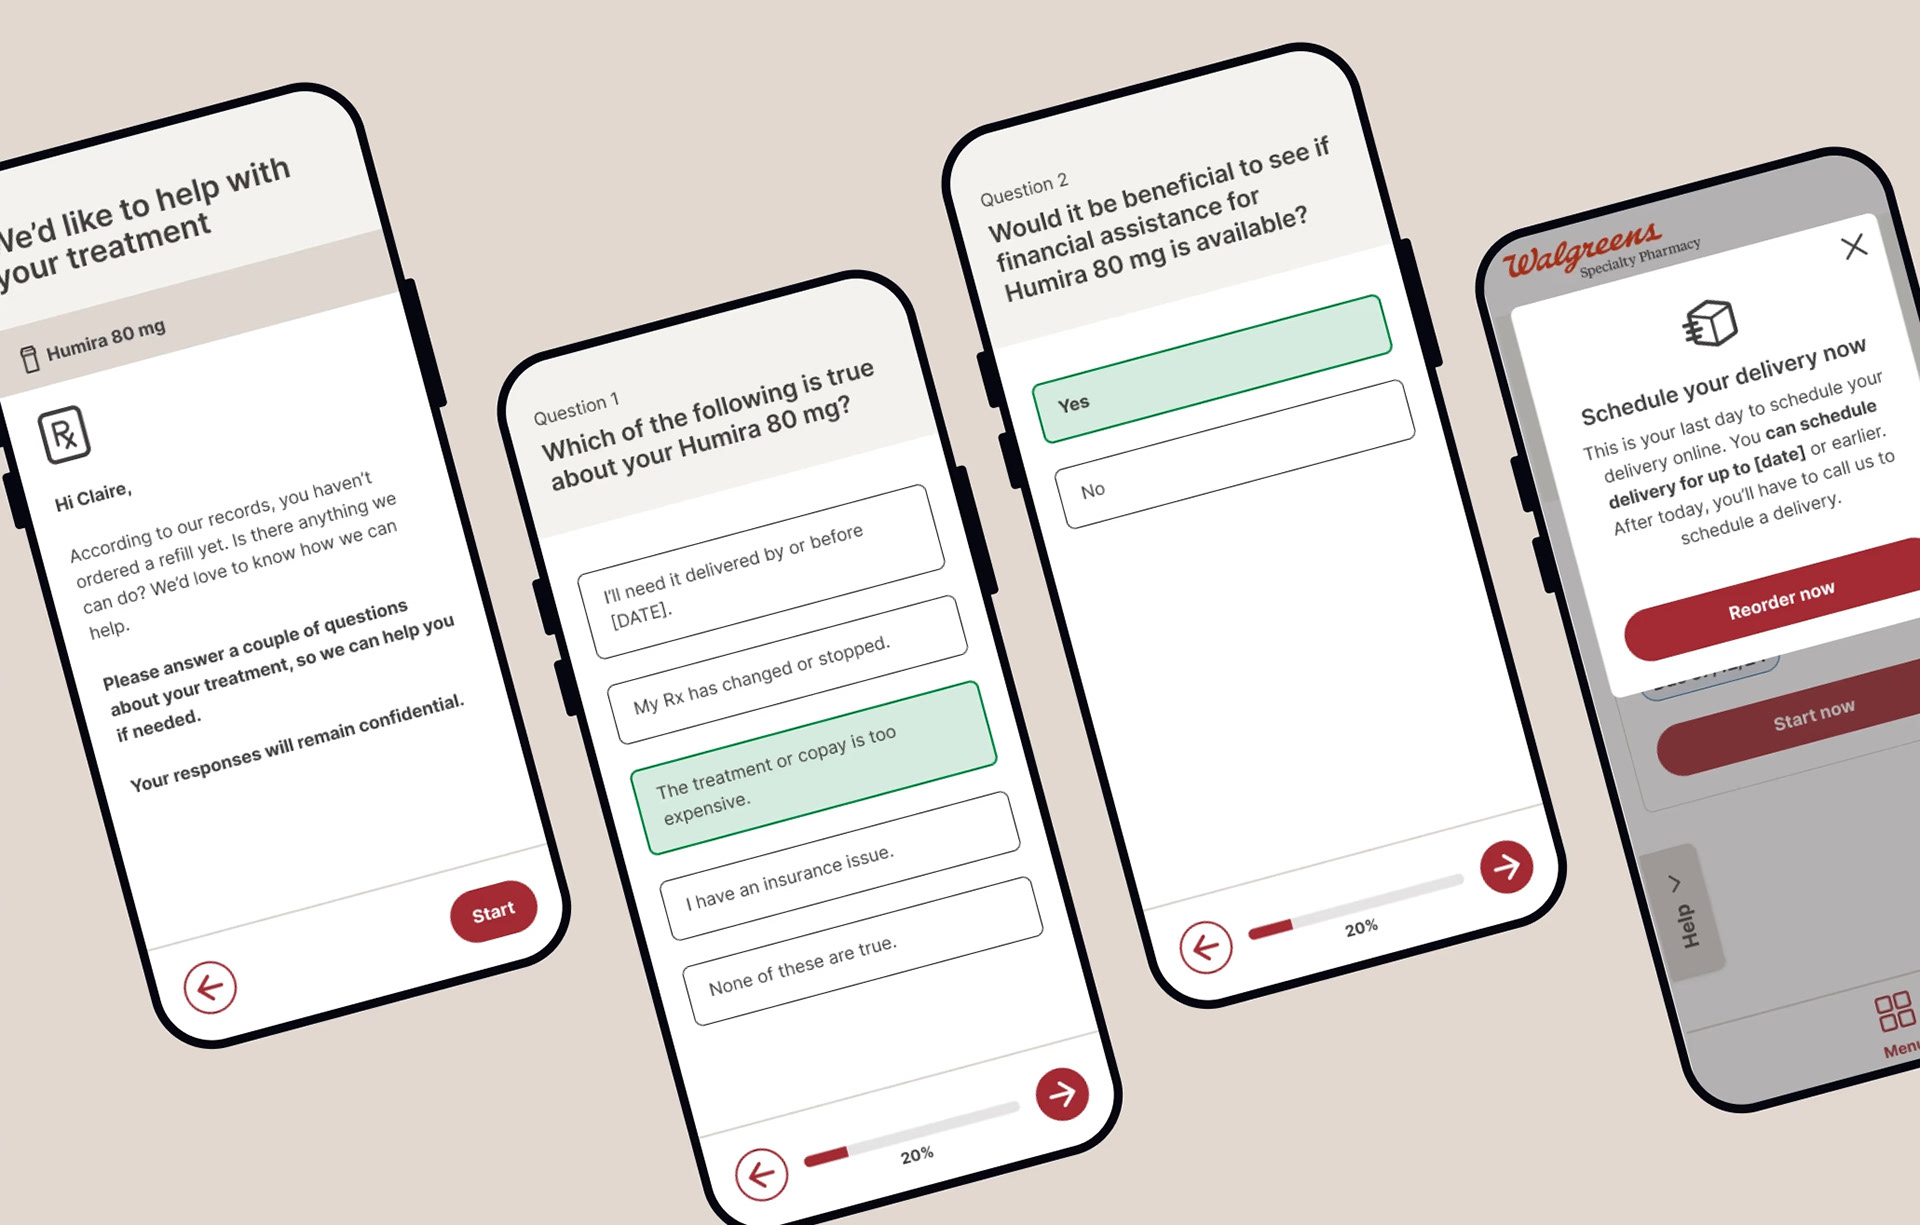
Three quarters of patients indicated that although they did not refill their medication on time, the planned to soon.
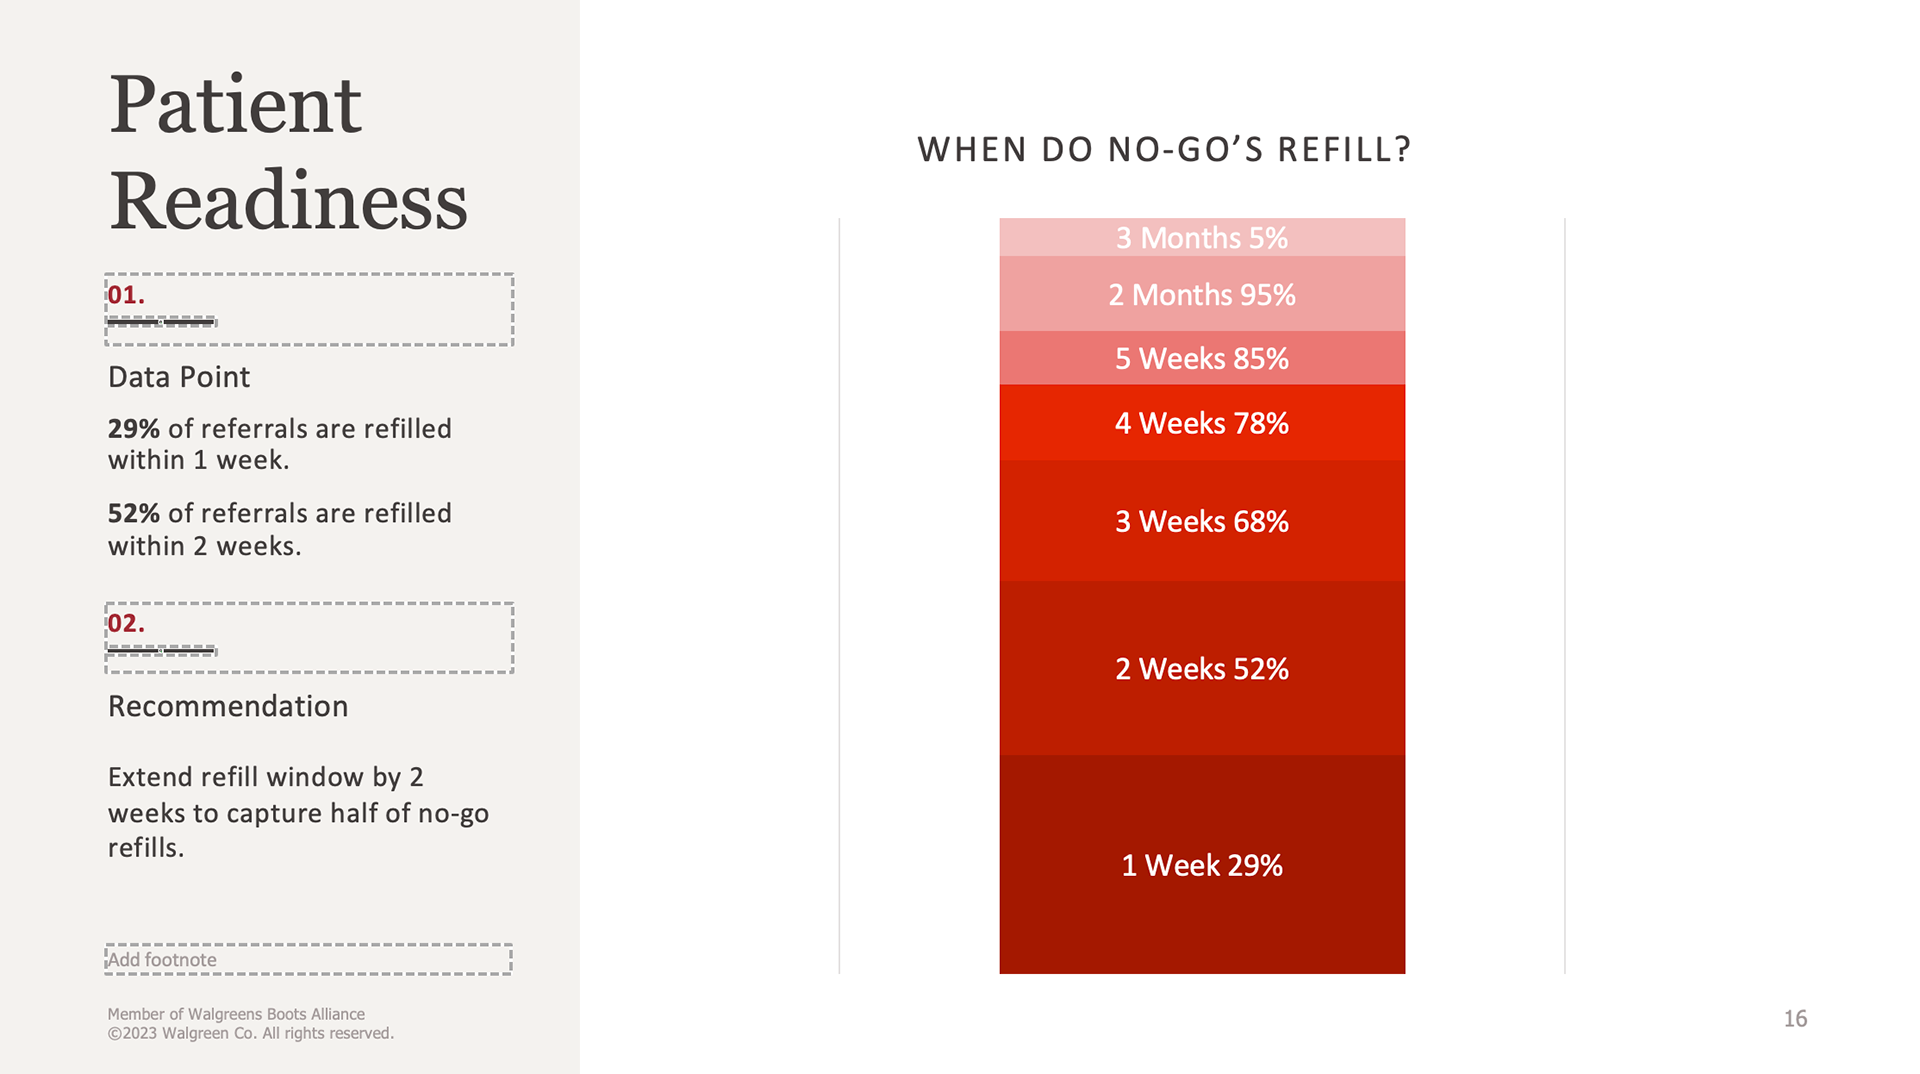
It's important to not rely on what people SAY they will do but to look at actual patient behavior. In practice, around half of patients will order their medication within 2 weeks of it "running out."
JOURNEY MAPPING
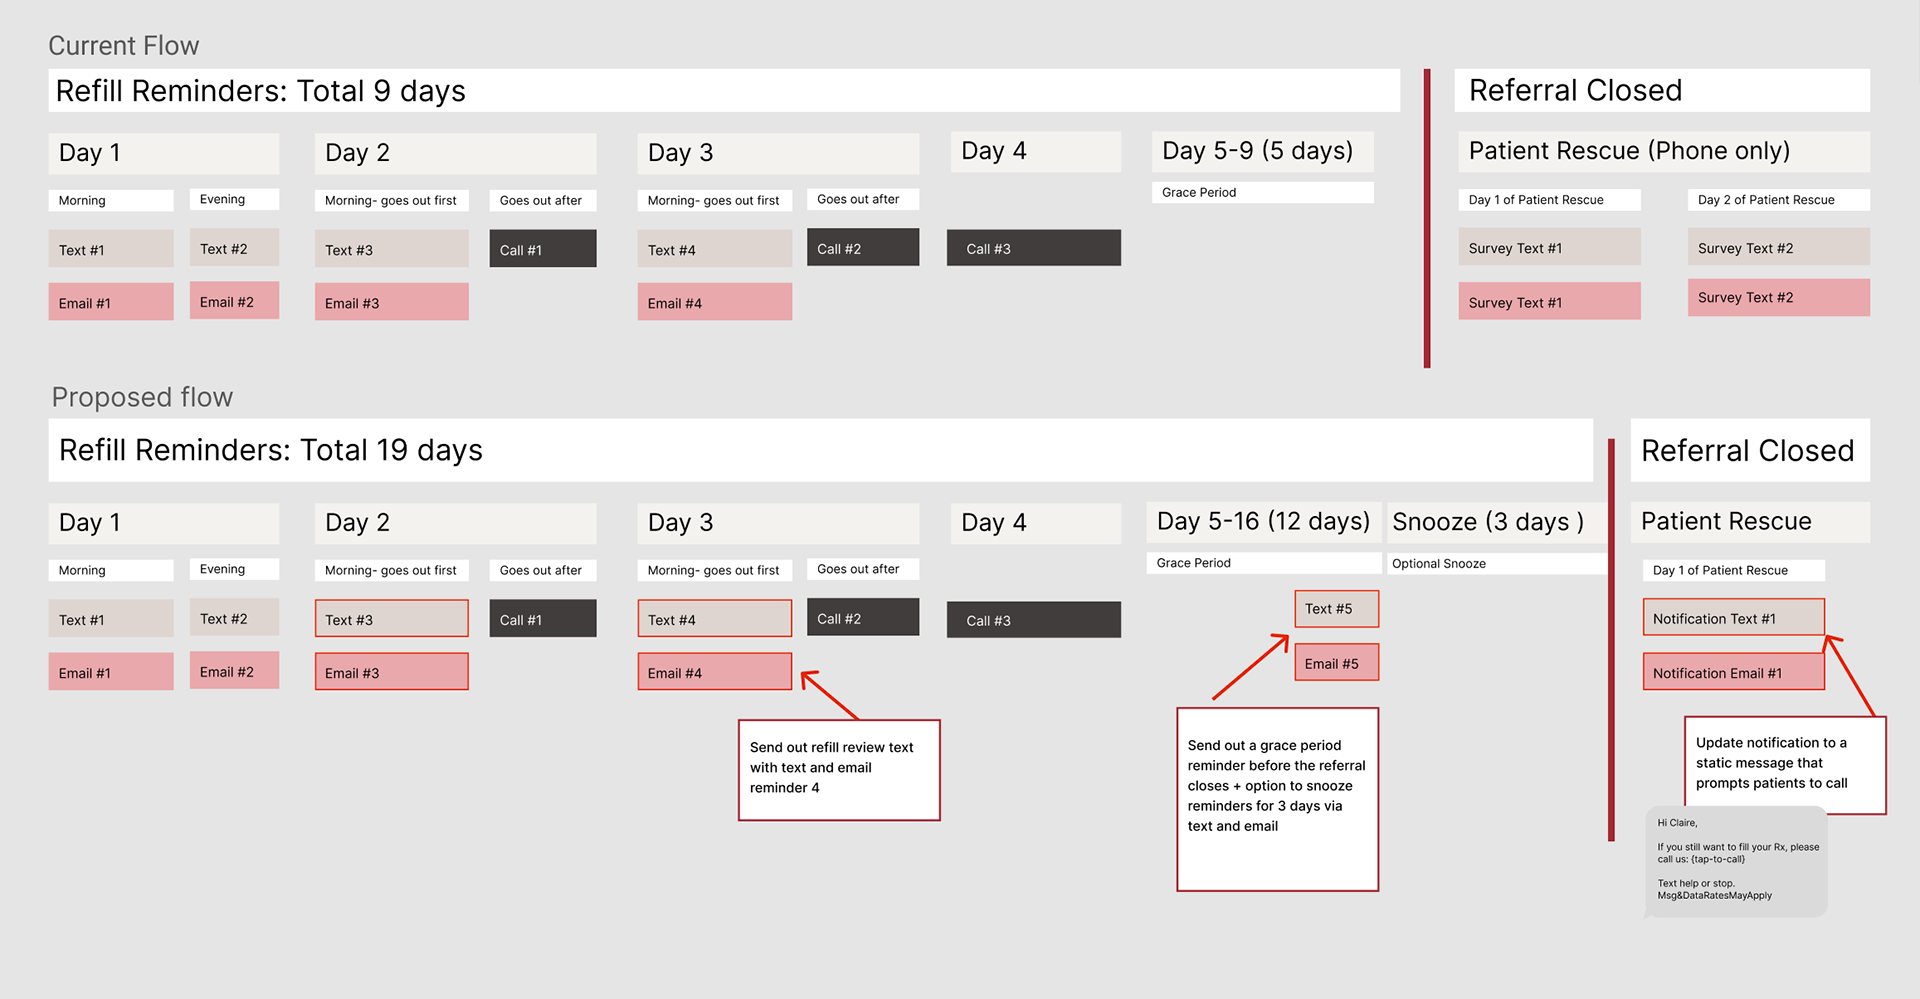
Patients get spammed with calls, texts, and emails for the first three days a script is eligible for refill. Then, there is just silence for the next 5 days and the refill window quietly closes without a reminder. Based on the survey results, I advocated for extending the refill window by 1-2 weeks so that patients can have more time to get their medications digitally. I also recommended sending a last-chance reminder the day before their script expires.
RESULTS AND REFLECTIONS
1. Based on a 9 months analysis post-implementation, the rate of cancelled orders has decreased 3-4%. I used financial modeling to calculate the cost savings, which is a continued 1.4 million each fiscal year.
2. Democratize the data. None of these changes would have been implemented without buy-in from various teams: operations, engineering, UX, and product. The way I gathered buy-in was to present the data in a easy-to-digest way and to frame it as a business issue, not a UX issue.
3. Quantify impact. Without the ability to quantify UX's impact, we don't get a seat at the table. But with the 1.4 million dollar number in hand, the UX team showed that good design is good for business and opened doors for additional design projects.